Note
Click here to download the full example code
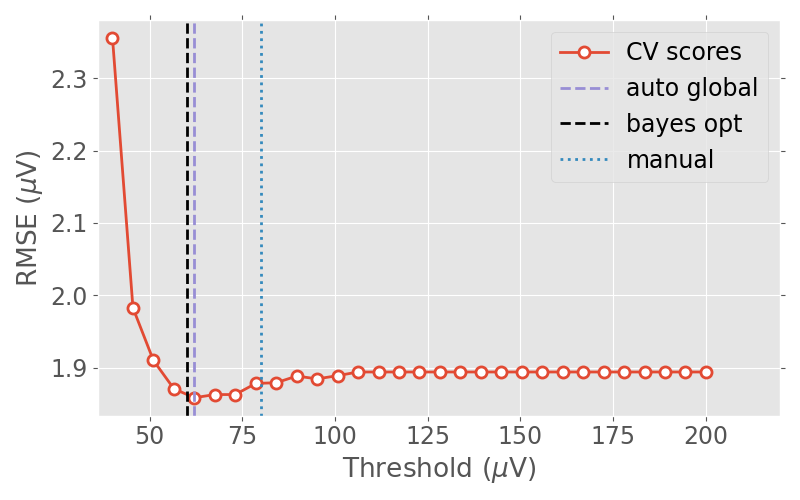
Plotting the cross-validation curve
This example demonstrates how to use autoreject to
plot the cross-validation curve that is used to estimate the
global rejection thresholds.
# Author: Mainak Jas <mainak.jas@telecom-paristech.fr>
# License: BSD-3-Clause
Let us import the data using MNE-Python and epoch it.
import mne
from mne import io
from mne.datasets import sample

event_id = {'Visual/Left': 3}
tmin, tmax = -0.2, 0.5

data_path = sample.data_path()
raw_fname = data_path + '/MEG/sample/sample_audvis_filt-0-40_raw.fif'
event_fname = data_path + ('/MEG/sample/sample_audvis_filt-0-40_raw-'
                           'eve.fif')

raw = io.read_raw_fif(raw_fname, preload=True)
events = mne.read_events(event_fname)

include = []
picks = mne.pick_types(raw.info, meg=False, eeg=True, stim=False,
                       eog=False, include=include, exclude='bads')
epochs = mne.Epochs(raw, events, event_id, tmin, tmax,
                    picks=picks, baseline=(None, 0),
                    reject=None, verbose=False, detrend=1)
Out:
Opening raw data file /home/stefanappelhoff/mne_data/MNE-sample-data/MEG/sample/sample_audvis_filt-0-40_raw.fif...
    Read a total of 4 projection items:
        PCA-v1 (1 x 10²)  idle
        PCA-v2 (1 x 10²)  idle
        PCA-v3 (1 x 10²)  idle
        Average EEG reference (1 x 60)  idle
    Range : 6450 ... 48149 =     42.956 ...   320.665 secs
Ready.
Reading 0 ... 41699  =      0.000 ...   277.709 secs...
Let us define a range of candidate thresholds which we would like to try. In this particular case, we try from \(40{\mu}V\) to \(200{\mu}V\)
import numpy as np  # noqa
param_range = np.linspace(40e-6, 200e-6, 30)
Next, we can use autoreject.validation_curve() to compute the Root Mean
Squared (RMSE) values at the candidate thresholds. Under the hood, this is
using autoreject._GlobalAutoReject to find global (i.e., for all
channels) peak-to-peak thresholds.
from autoreject import validation_curve  # noqa
from autoreject import get_rejection_threshold  # noqa

_, test_scores, param_range = validation_curve(
    epochs, param_range=param_range, cv=5, return_param_range=True, n_jobs=1)

test_scores = -test_scores.mean(axis=1)
best_thresh = param_range[np.argmin(test_scores)]
We can also get the best threshold more efficiently using Bayesian optimization
reject2 = get_rejection_threshold(epochs, random_state=0, cv=5)
Out:
Estimating rejection dictionary for eeg
Now let us plot the RMSE values against the candidate thresholds.
import matplotlib.pyplot as plt  # noqa
from autoreject import set_matplotlib_defaults  # noqa
set_matplotlib_defaults(plt)

human_thresh = 80e-6  # this is a threshold determined visually by a human
unit = r'$\mu$V'
scaling = 1e6

plt.figure(figsize=(8, 5))
plt.tick_params(axis='x', which='both', bottom='off', top='off')
plt.tick_params(axis='y', which='both', left='off', right='off')

colors = ['#E24A33', '#348ABD', '#988ED5', 'k']

plt.plot(scaling * param_range, scaling * test_scores,
         'o-', markerfacecolor='w',
         color=colors[0], markeredgewidth=2, linewidth=2,
         markeredgecolor=colors[0], markersize=8, label='CV scores')
plt.ylabel('RMSE (%s)' % unit)
plt.xlabel('Threshold (%s)' % unit)
plt.xlim((scaling * param_range[0] * 0.9, scaling * param_range[-1] * 1.1))
plt.axvline(scaling * best_thresh, label='auto global', color=colors[2],
            linewidth=2, linestyle='--')
plt.axvline(scaling * reject2['eeg'], label='bayes opt', color=colors[3],
            linewidth=2, linestyle='--')
plt.axvline(scaling * human_thresh, label='manual', color=colors[1],
            linewidth=2, linestyle=':')
plt.legend(loc='upper right')
plt.tight_layout()
plt.show()
Total running time of the script: ( 0 minutes 2.964 seconds)
